We just removed the max rows button for now untill fix is released.
Bug 14772000 : UNABLE TO SCROLL AS IE 8.0 PERFORMANCE POOR FOR MAX ROWS IN DASHBOARD Oracle has no fix.. So this was a temp workaround. They blame IE8.
If you set the below two values to the same value - the max drop down arrow dissappears this needs to done within the instanceconfig.xml
Default rows displayed = incremental button on dashboard
Max visible rows = Display max rows per page or goto end of report -- if stable number can be high ----- if the following entries dont exist add them : refer to the Post Link Click here
<Views> <Pivot> <!--This Configuration setting is managed by Oracle Enterprise Manager Fusion Middleware Control--> <DefaultRowsDisplayedInDelivery>75</DefaultRowsDisplayedInDelivery> <!--This Configuration setting is managed by Oracle Enterprise Manager Fusion Middleware Control--> <DefaultRowsDisplayedInDownload>8000000</DefaultRowsDisplayedInDownload> <!--This Configuration setting is managed by Oracle Enterprise Manager Fusion Middleware Control--> <DisableAutoPreview>false</DisableAutoPreview> <MaxVisibleColumns>1500</MaxVisibleColumns> <DefaultRowsDisplayed>3000</DefaultRowsDisplayed><MaxVisiblePages>1500</MaxVisiblePages> <MaxVisibleRows>3000</MaxVisibleRows><MaxVisibleSections>50</MaxVisibleSections> <MaxCells>50000000</MaxCells> </Pivot> <Table> <!--This Configuration setting is managed by Oracle Enterprise Manager Fusion Middleware Control--> <DefaultRowsDisplayedInDelivery>75</DefaultRowsDisplayedInDelivery> <!--This Configuration setting is managed by Oracle Enterprise Manager Fusion Middleware Control--> <DefaultRowsDisplayedInDownload>8000000</DefaultRowsDisplayedInDownload> <DefaultRowsDisplayed>3000</DefaultRowsDisplayed><MaxVisiblePages>1500</MaxVisiblePages> <MaxVisibleRows>3000</MaxVisibleRows><MaxVisibleSections>50</MaxVisibleSections> <MaxCells>50000000</MaxCells> </Table> <Charts> <JavaHostReadLimitInKB>0</JavaHostReadLimitInKB> </Charts> </Views>
Example content mycriteriablocking.js as (Just create in notepad or something and save as all files with extension .js)
// This is a function to block query combinations in subject area and apply mandatory filters etc. Shahed M
function validateAnalysisCriteria(analysisXml)
{
// Create the helper object
var tValidator = new CriteriaValidator(analysisXml);
// This logic will only apply to the subject area specified
if (tValidator.getSubjectArea() == "My Subject Area")
{
// If Date is picked from Calendar Folder then Active filter is mandatory from the same Folder
if (!tValidator.dependentFilterExists("Calendar","Date","Calendar","Active"))
return "Please apply Filter on Active";
// If any field from Fact Folder is picked then Date from Calendar Folder is mandatory
if (!tValidator.dependentFilterExists("My Fact","Amount","Calendar","Date"))
return "Please apply Date Filter from Calendar Folder";
}
// If everything is ok then
return true;
}
6. Bounce all Services for OBIEE incuding Weblogic.
You can keep ammending the mycriteriablocking.js without bouncing the box once the first bounce is complete
7. in OBIEE refresh Metadata within the Administration tab
8. Test solution and keep ammending the mycriteriablocking.js as needed.
Other Notes (David)
Change the admin console Deployments > analytics (11.1.1) > analytics > Resource Reload Check (in seconds)" = 0 for the js code to be refreshed on the server. And testing on the client web browser requires force refresh (Ctrl+F5).
Oracle’s Example
// This is a blocking function. It ensures that users select what
// the designer wants them to.
function validateAnalysisCriteria(analysisXml)
{
// Create the helper object
var tValidator = new CriteriaValidator(analysisXml);
// Validation Logic
if (tValidator.getSubjectArea() != "Sample Sales")
return "Please try Sample Sales?";
if (!tValidator.dependentColumnExists("Markets","Region","Markets","District"))
{
// If validation script notifies user, then return false
alert("Region and District are well suited, do you think?");
return false;
}
if (!tValidator.dependentColumnExists("Sales Measures","","Periods","Year"))
return "You selected a measure so pick Year!";
if (!tValidator.filterExists("Sales Measures","Dollars"))
return "Maybe filter on Dollars?";
if (!tValidator.dependentFilterExists("Markets","Market","Markets"))
return "Since you are showing specific Markets, filter the markets.";
var n = tValidator.filterCount("Markets","Region");
if ((n <= 0) || (n > 3))
return "Select 3 or fewer specific Regions";
return true;
}
List of Validator functions
Validation Helper Function
Description
CriteriaValidator.getSubjectArea()
Returns the name of the subject area referenced by the analysis. It generally is used in a switch statement within the function before doing other validation. If the analysis is a set-based criteria, then it returns null.
CriteriaValidator.tableExists(sTable)
Returns True if the specified folder (table) has been added to the analysis by the content designer, and False if the folder was not added.
CriteriaValidator.columnExists(sTable, sColumn)
Returns True if the specified column has been added to the analysis by the content designer, and False if the column was not added.
Checks to ensure that the dependentColumn exists if the checkColumn is present. It returns True if either the checkColumn is not present, or the checkColumn and the dependent column are present. If checkColumn and dependentColumn are null, then the folders are validated. If any column from checkTable is present, then a column from dependentTable must be present.
Checks to ensure that the dependentFilter exists if the checkColumn is present in the projection list. It returns True if either the checkColumn is not present, or the checkColumn and the dependent filter are present.
Returns the number of filter values that are specified for the given logical column. If the filter value is "equals," "null," "notNull," or "in," then it returns the number of values chosen. If the column is not used in a filter, then it returns zero. If the column is prompted with no default, then it returns -1. For all other filter operators (such as "greater than," "begins with," and so on) it returns 999, because the number of values cannot be determined.
Following are new features in OBIEE 11.1.1.7.0 as appears in the documents.
From Certification Matrix we learn they are new sources and new versions of certified data sources:
New Certified Data Sources:
·Apache Hive 0.9.x
·MySQL 5.5.14+
New versions of Data Sources:
·IBM DB2 10, IBM DB2 for z/OS 9.1 (and not only DB2 9.1, 9.5, 9.7 as usual).
·Microsoft SQL Server 2012 (not only 2005, 2008)
·Aster Datadabase 5.0 (and not only 4.6.2)
From the Documentation we learn about many new features:
New installation Features:
·Installing Oracle Business Intelligence on IBM WebSphere - Oracle WebLogic Server is the primary platform for Oracle Fusion Middleware software components. In this release, when you perform a Software Only install of Oracle Business Intelligence you can select Oracle WebLogic Server or IBM WebSphere.
·Configuring Oracle Essbase Suite when Installing Oracle Business Intelligence -Oracle Essbase database provides multidimensional analysis, enabling rapid development of custom analytic and enterprise performance management applications. In this release, when you install Oracle Business Intelligence you can select to configure Oracle Essbase database and its associated tools.
·Installing BI Composer - When performing a new 11.1.1.7 BI installation, BI Composer is automatically installed and configured. (in previous 11 versions you needed to configure it.)
·Smart View - Starting with Release 11.1.1.7, Oracle BI Add-in for Microsoft Office is replaced by Oracle Hyperion Smart View for Office (Smart View) as a comprehensive tool for accessing and integrating Oracle Business Intelligence and Enterprise Performance Management content from Microsoft Office products. Smart View provides a commonMicrosoft Office interface designed for Oracle Business Intelligence and Oracle Enterprise Performance Management.
New UI Features:
·Recommended Visualizations Feature for Creating Views - In this release, when you create a view, you can choose a recommended view type based on the data in your analysis and, optionally, what you want to use it for (for example, to analyze trends). You can choose a suggested "Best Visualization" as well as a "Recommended Subtype". Or you can instead choose the "Recommended Visualization" option, for which you specify your intent for the new view. For example, will the view compare values, compare percentages, visualize trends, or something else? From a list of suggested view types that is ordered with the best option at the top, you can then choose your preferred view type.
·Breadcrumbs - Breadcrumbs have been added to help users understand their current location within Oracle BI content and the path that they have used to navigate Oracle BI content. Breadcrumbs display at the bottom of the page, and users can click a breadcrumb or the breadcrumb overflow button to navigate to a specific location on their breadcrumb trail.
·Enhancement to Dashboards - This release provides the following enhancements to dashboards:
oThe ability to create custom print layouts for high-fidelity printing of dashboard pages (Using integration with BI Publisher).
oThe new default style is FusionFX.
oThe addition of the Freeze Column option to the Column Properties menu. This option allows you to freeze a column at an edge (top or left) of a dashboard layout.
oThe addition of the following options that allow you to control the position and size of columns and sections:
§Size option in the Additional Formatting Options area of the "Section Properties dialog" and the "Column Properties dialog"
§Page Size option in the "Dashboard Properties dialog"
oThe ability to export an entire dashboard or a single dashboard page to Microsoft Excel 2007+ (I heard many request in that direction. See picture on the right).
oThe addition of options to replace an analysis on a dashboard and to return to a dashboard from the Analysis editor:
§The Replace analysis in <dashboard name> option was added to the Save As dialog. This option displays when the user is viewing a dashboard, clicks an embedded analysis' Analyze or Edit link, edits the analysis, and selects Save As to rename and save the analysis. The Replace analysis in <dashboard name> option allows the designer to choose to include the modified analysis on the dashboard.
§The Return to <dashboard name> option was added to the Analysis editor. This option displays in the Analysis editor when the user is viewing a dashboard and clicks an embedded analysis' Analyze or Editlink. The designer can click this option to easily move from the Analysis editor to the dashboard.
·Enhancements to Graphs - In this release graphs have been enhanced in various ways.
oNew graph types include:
§Waterfall graph. A waterfall graph lets you visualize how a value increases or decreases sequentially and cumulatively. An initial value is summed with subsequent values (both negative and positive changes or deltas) to arrive at an end value, focusing your attention on how each measure contributes to the whole.
§Stacked graph as a new subtype to the area graph. A stacked graph is useful for comparing the proportional contributions within a category. A stacked graph displays the relative value that each part contributes to the whole.
§100% stacked graph as subtypes to the bar graph and the area graph. A 100% stacked graph, like the stacked graph subtype, lets you compare the parts to the whole. But while the stacked graph shows cumulative total in the units of the measure, the 100% stacked graph always shows units as percentages of the total, and the axis scale is always zero to 100 percent.
oZoom to data range. This option lets the system evaluate the range of values on an axis, and choose appropriate minimum and maximum values for the scale. This is useful when graphing a set of large values that are all within a small percentage of each other.
oHide sliders in graph views that listen to master-detail events. For graphs in master-detail relationships, if you want to simplify the appearance of an analysis or dashboard, you can hide the slider that is created to accommodate detail columns.
·Enhancements to Views - This release includes enhancements to various view types, including those in the following list:
oA new view type named performance tile. This view type displays a single aggregate measure value in a manner that is both visually simple and prominent.
oAction links in trellis views. In simple trellis views, action links can now be used on inner graphs per unit, including the context of the outer edges. Action links can also be used in legends and in axis labels. In advanced trellis views, action links can be used in microcharts, where the microchart functions as a single unit (such as an aggregate number), including the context of the outer edges.
oFor map views:
§Vary the width of a line by measure to accentuate a feature.
§Link a map view as a detail in a master-detail relationship.
§Auto Correct option. A map view error can occur for various reasons. If the issue appears to be related to missing layers, maps, or styles, then it might be possible to correct the map by replacing the missing map view components with similar items that exist in the spatial metadata.
§Legend and formatting highlighting.
oNull suppression at view and analysis levels. You can set null suppression options at the view level (which overrides the analysis level) for data views including: table, pivot table, trellis (both simple and advanced), graph, gauge, and funnel views when the entire row or column contains nulls.
oAbility to include or exclude calculated items and groups at the view level for columns and column headers. Specifically, two new options have been added:Include Custom Member and Exclude Custom Member. These interactions are available for tables, pivot tables, and trellises.
oFor tables, pivot tables, and advanced trellises, the ability to:
§Specify the method to be used to browse data — either scrolling or paging controls. For more information, see "Table Properties dialog: Style tab","Pivot Table Properties dialog" and "Trellis Properties dialog: General tab".
§Resize rows and columns.
oRow count. If your table or pivot table view contains a grand total or subtotal on the row edge, the display totals, that is the grand total and subtotals, are now included in the Rows per Page count for content paging. In prior releases, if you had the Rows per Page count set to 10 for example, the table or pivot table would display more than 10 records if display totals were shown in the view results.
oFor right-click interactions, the ability to specify whether the Hide Columnsinteraction is available at runtime.
·Enhancements to Prompts - This release includes enhancements to prompts, including those in the following list:
oEnhancement to the SQL Results prompt option. If you are working with double columns, you can now write the SQL statement so that filtering is done on code values rather than display values.
oEnhancement to the prompt constraint option. The prompts designer can now limit a column prompt value list by more than one column.
oEnhancements to the parameters for prompted links.
·New Menu Options for Exporting Views and Results - Excel 2007+ and Powerpoint 2007+ options for exporting views and results.
·Total Member Placement for Hierarchical Columns - This release includes an enhancement that allows placement of total members on a hierarchy.
·Browse Catalog Search Results by Object Attributes - This release provides the capability to use full-text search to find catalog objects and then filter the search results by attributes. This search is available when the administrator integrates Oracle BI Enterprise Edition with Oracle Endeca Server. After the full-text search results are returned, the Catalog area displays a list of matching items, and the Search pane displays the search results grouped by attribute (that is, Type, Name, Path, and Created By).
·Navigate from the Total or Grand Total in a Table or Pivot Table - If an analysis contains a total or grand total and the associated attribute or hierarchical column contains an action link or a conditional action link, the action link (or conditional action link) is applied to both the column and the total or grand total.
·New BI Desktop Tools Available for Download - This release adds the following tools to the list of BI desktop tools that are available for download:
oOracle Hyperion Smart View for Office
oOracle Hyperion Financial Reporting Studio (if Essbase is installed)
oOracle Essbase Studio Console (if Essbase is installed)
oOracle Essbase Administrative Services Console (if Essbase is installed)
·Enhancement to Favorites - This release provides the capability to organize your favorites from the Category Tree area and the Selected Category area in the Manage Favorites dialog. In previous releases, you could organize favorites from the Category Tree area, only.
·Integration of Oracle BI EE with Oracle Enterprise Performance Management System -With this release, Oracle BI EE is integrated with Enterprise Performance Management Workspace.
New Features for Oracle BI Mobile:
This section describes new features for Oracle BI EE 11g Release 1 (11.1.1.7). With this release, there is a brand-new application to install from the Apple App Store.
This release provides end-user enhancements in the following areas:
·Maximize views with double-tap gesture. With this new feature, you can access on your iPad more data—even within dense dashboards—without the restrictions of the smaller form factor. You expand an individual view by double-tapping on it. The individual view then displays within the full screen of the iPad. This maximizing of views can be done on views accessed within a dashboard, and also when viewing an analysis independent of a dashboard.
·New view and graph types (described above): Performance tiles,Waterfall graphs, 100% stacked graph as subtypes to the bar graph and the area graph, Stacked graph as a new subtype to the area graph,Fixed headers.
·Changing between landscape and portrait orientation while viewing Oracle BI content.See "Switching Screen Orientation Between Landscape and Portrait."
·Breadcrumbs. You can see the navigation path you have taken while moving through the catalog as a trail of breadcrumbs (near the top of the screen by the Back arrow). In this way, you can see your current location and how you got there, then decide whether to use the Back arrow to navigate in reverse, or to use the Home icon to quickly return to the Home screen.
·Security toolkit. The Oracle Business Intelligence Mobile Security Toolkit provides the ability to generate a signed version of the Oracle BI Mobile HD application. The toolkit includes the instructions and necessary content to build this application making use of Apple's Xcode and the IOS SDKs. The Oracle BI Mobile Security Toolkit will be updated on a regular basis in order to synchronize with the Oracle BI Mobile HD application available on the Apple App store.
·Viewing of Oracle BI Publisher reports in dashboards. (Bug in previous version.)
New metadata repository features:
·Changing the Repository Password From the Command Line -You can now change the repository password from the command line using the obieerpdpwdchg utility.
·New Options to Enforce Consistent Versions in Multiuser Development Environments -You can now add options to the multiuser development option file to enforce Administration Tool, MUD protocol, and RPD version consistency among MUD developers.
·New Utilities Available to Generate and Compare Logical Column Type Information -You can use the Administration Tool utilities Generate Logical Column Type Document and Compare Logical Column Types to generate a list of logical column types, and then compare it with logical column types in a subsequent version of the repository. You can also use the command-line utility biservergentypexml to generate the list of logical column types.
·Additional Database Support for Cardinality Estimates in Oracle BI Summary Advisor -The Prefer Optimizer Estimates feature, which improves performance by using cardinality estimates during the Summary Advisor process, is now available for Microsoft SQL Server and IBM DB2.
·Oracle BI Summary Advisor Measure Subset Recommendations - Oracle BI Summary Advisor now recommends only aggregates that contain specific measures that are both present in the analyzed query workload, and that can optimize the query workload if aggregates are created.
·Model Check Manager Enhancements - Model Check Manager now runs parallel queries against the database for better performance. In addition, you can now check models from the command line using the validaterpd utility with the -L option.
·Access to Apache Hadoop Data Sources - Oracle BI EE now supports Apache Hadoop as a data source.
·Support for Multi-Source Session Variables - Oracle BI EE now supports session variables that can be populated from multiple data sources and retain values from all source systems.
·NUMERIC Data Type Support for Oracle Database and TimesTen - You can now change a configuration setting to enable NUMERIC data type support for Oracle Database and TimesTen.
·Ability to Map Flex Object Changes Using the biserverextender Utility - You can now use the biserverextender utility to import flex object changes from ADF data sources and map them to the Business Model and Mapping layer and Presentation layer.
·Support for Servlet Communication Between the Oracle BI Server and Oracle OLAP -The Oracle BI Server now uses a servlet for communication with Oracle OLAP data sources, rather than relying on the JavaHost service.
New Privileges - The following new privileges were added to the Presentation Services Administration page:
·Access to Export
·User Population - Can List Application Roles
·Access to Permissions Dialog
·Add to snapshot briefing book
·Download Entire Dashboard To Excel
·Download Single Dashboard Page To Excel
·Add/Edit Performance TileView
New system administration features:
·Support for Oracle Endeca Server - You can configure Oracle Endeca Server as a search engine for full-text searching.
·Support for Multitenancy - You can configure Oracle BI EE so that it supports the use of multiple tenants.
·Integration of Oracle BI EE with Essbase - Essbase functionality is closely integrated with Oracle BI EE.
·New Configuration Required for Performance Tiles - To specify the scaling factor that accompanies a number in a performance tile view, you must manually edit the localedefinitions file, as described in Section 15.2.1.5, "Specifying the Scaling of Numbers in Performance Tiles."
·New Configuration Element for Dashboards - A new configuration setting is available to enable the ability to export dashboard pages to Oracle BI Publisher.
·New Configuration Element and New Default Values for Interactions in Views - A new configuration setting, InteractionPropertyHideColumns, is available to specify the default setting for the Hide Columns option in the Analysis Properties dialog: Interactions tab. In addition, only InteractionPropertyDrill,InteractionPropertyInclExclColumns, InteractionPropertyMoveColumns, and InteractionPropertySortColumns are set to true by default.
Calling the Oracle Business Intelligence Metadata Web Service Asynchronously
The Oracle Business Intelligence Metadata Web Service provides asynchronous and synchronous calls to Oracle BI Server stored procedures. You use these procedures to obtain information about the metadata and to modify the metadata.
New features for report designers in Oracle BI Publisher:
·Connect Directly to Oracle BIEE Subject Areas to Create Reports -
·You can now create BI Publisher reports that use a direct connection to an Oracle BI server subject area without having to build an additional data model in BI Publisher!!!
·Excel Template Builder Enhancements - The Excel Template Builder now supports automatic insertion of fields and repeating groups removing the requirement to manually assign defined names to cells. You can also connect directly to the BI Publisher server to download sample data, create new reports in the catalog, and upload templates from your Excel session.
·Layout Editor Enhancements -Enhancements added to the layout editor are:
oTime series axis formatting
oHide axis option
oIndependent axis formatting
·Enhanced Create Report Guide -The Create Report guide is enhanced to assist report designers with the process of creating a report from selecting the data model to configuring the report layout.
·PDF to PCL Conversion for Embedding PCL Commands in RTF Templates
·BI Publisher now provides a PDF to PCL converter. Using this utility, you can embed PCL commands in an RTF template and, after generating PDF output, the delivery manager converts the PDF to PCL before sending it to the printer to enable support for PCL printers. This feature is provided to support check printing.
·Support for PDF 1.7 Specification
·In versions of BI Publisher earlier than 11.1.1.7, the PDF utilities required that all PDF input documents be PDF version 1.4. Starting with this release users can pass PDF documents of later versions to the BI Publisher PDF utilities. The instructions in Chapter 7, "Creating PDF Templates" have been revised, removing this requirement.
New features for administrators in Oracle BI Publisher:
·Integration with Oracle Endeca - BI Publisher now supports integration with Oracle Endeca as a data source for reports.
·PDF to PCL Converter - BI Publisher now provides a PDF to PCL converter to enable the printing of PDF output to a PCL printer. This enables the embedding of PCL commands in RTF templates that are executed by the printer when the document is printed. For example, the ability to switch to a specific font cartridge.
·Support for Private Data Sources - Data model developers can now create and manage private JDBC and OLAP data source connections for use in SQL or MDX data sets without having to depend on Administrators. However, Administrator users can still view, modify, and delete private data source connections, as well as extend access to other users.
New features for data model developers in Oracle BI Publisher:
·MDX Query Builder - You can now use the MDX Query Builder to build a MDX query by selecting OLAP cube dimension members for Column, Row, Page, & slicer (for Point of View) axes. This feature enables you to build member selections in the MDX query by using specific members, relations such as children and descendants, and layers such as levels and generations.
·Support for Local XML File Data Source - You can now use a locally stored XML or shared XML file as data source for data sets. This file can then be refreshed on demand from the data model definition.
·Support for CSV File as a Data Source -You can now use a locally stored CSV or shared CSV file as data source for data sets. This file can then be refreshed on demand from the data model definition.
·Support for Endeca as a Data Source -You can now use Endeca as a data source.
·Support for Private Data Sources - You can now use private JDBC or ODBC data source connections to create a data set with a BI Publisher data model.
·Enhancements for Sample Data Usability - You can now view and save data model results on the new View tab without browser dependencies. These improvements are intended to make working with sample data in BI Publisher easier and more consistent.
·Enhancements to Event-Driven Schedules - Now when you define an event-driven schedule, you can also set a retry interval to have BI Publisher automatically re-execute the trigger to test for the condition to run the report. Two new fields have been added to support this feature: Retry Limit and Pause Time. Using these fields you can define the number of times for BI Publisher tocheck the condition and the time interval to wait between attempts.
·New Parameter Type: Flexfields (for Oracle E-Business Suite Users) - For Oracle E-Business Suite users, support for the flexfield parameter type has been added in this release. BI Publisher's report viewer can now integrate with flexfield definitions in Oracle E-Business Suite to enable you to select flexfield segment value ranges to pass to your report.
As Oracle example does not work on OBIEE 11.1.1.6.8 , we had to figure out a work around to achieve more complex scenarios. Such as one Presentation folder(Multiple fields) and enforce a filter from dimension folder. This is code that is inserted into the mycriteriablocking.js file.
! = Does Not exist & = AND || = OR
Oracle Example does not work !! , Well would not work for us.
if (!tValidator.dependentColumnExists("Sales Measures","","Periods","Year"))
return "You selected a measure so pick Year!";
Working DeliverBI Examples
Blocking Anaylsis based on any column within a Presentation Folder and enforcing a mandatory filter from another Folder
if (tValidator.tableExists("Fact Table") )
{
if (!tValidator.filterExists("DimensionTable","DimensionColumn"))
return "Please apply DimensionColumn Filter from Dimension table folder when choosing data from Fact Table";
}
Blocking Anaylsis based on usage of any two Folders and enforcing a mandatory filter from a 3rd folder.
if (tValidator.tableExists("DimensionTable") & tValidator.tableExists("Fact Table") )
{
if (!tValidator.filterExists("DimensionTable2","DimensionColumn2"))
return "Please apply DimensionColumn2 Filter from DimensionTable2";
}
Example using a java or condition which is || Check 2 tables independantly to see if they exist and if they do apply filters from 2 different dimension tables and 3 columns. Use this method so if multiple folders/tables uses the same criteria you dont have to keep repeating the logic . Just use OR on the table || if (tValidator.tableExists("Fact Folder") || tValidator.tableExists("Another Fact Folder") ) { if (!tValidator.filterExists("Calendar","Active Flag") || !tValidator.filterExists("Calendar","Date") || !tValidator.filterExists("Regions Dimension","Region") ) return "Please apply Date and Active Flag filters from Calendar folder along with Region filter from Region Dimension folder"; } Example to check 2 columns from 2 different fact folders and apply a filter from a dimension folder column and restrict the dimension column filter to 1 value
if (tValidator.columnExists("Fact Table 1","Fact Region Amount") || tValidator.columnExists("Fact Table 2","Fact City Amount"))
{
var n = tValidator.filterCount("Region Folder","Region");
if ((n <= 0) || (n > 1))
return "Please filter region from region folder and restrict region filter to only 1 region";
}
When a dimension folder is used with any of our 3 fact folders then atleast 1 column filter should exist from the the dimension folder Will force either the city or region column filter to exist if any of the three fact tables are used independantly of each other. if (tValidator.tableExists("Region Dim")) { if (tValidator.tableExists("Fact 1") || tValidator.tableExists("Fact 2") || tValidator.tableExists("Fact 3")) { if (!tValidator.filterExists("Region Dim","Region") & !tValidator.filterExists("Region Dim","City")) return "Please apply filter on either Region or City field from Region Dim Folder"; } }
This was a complex one for us as our java is a bit rusty, Hey we got it to work so great
When Any two or more dimensional folders are used without a FACT table being introduced this will flag an error and not let the user continue without a FACT. You must state all dimension tables within the MYArray below for this to work. We have included only four dimension tables in this example.
We achieved this by adding up the dimension tables used
Another Patchset out . Fixes quite alot .. 11.1.1.6.2.1 BP1 Patch
Patches 11.1.1.6.2 BP1
OBIEE Version 11.1.1.6.2 (Build 120605.2000 BP1 64-bit)
- 14223977 Patch 11.1.1.6.2 BP1 (1 of 7) Oracle Business Intelligence Installer - 14226980 Patch 11.1.1.6.2 BP1 (2 of 7) Oracle Real Time Decisions - 13960955 Patch 11.1.1.6.2 BP1 (3 of 7) Oracle Business Intelligence Publisher - 14226993 Patch 11.1.1.6.2 BP1 ( 4 of 7) Oracle Business Intelligence ADF Components - 14228505 Patch 11.1.1.6.2 BP1 (5 of 7) Enterprise Performance Management Components Installed from BI Installer - 13867143 Patch 11.1.1.6.2 BP1 (6 of 7) Oracle Business Intelligence - 14142868 Patch 11.1.1.6.2 BP1 (7 of 7) Oracle Business Intelligence Platform Client Installers and MapViewer
Pre Requisite Patch is the 11.1.1.6.2 Patch in earlier post.
Some of the Fixes
Fixes SQL Direct Database Requests with a Prompt not refreshing on dashboard
6197675 PROVIDE CAPABILITY TO DOWNLOAD REPORT WITH FILTERS USING GO-URL ACTION=DOWNLOAD 9884975 11G ADMIN TOOL RECEIVES NQSERROR: 37005 WHEN SAVING ONLINE RPD CHANGES 10199188 CHARTS X AXIS LABEL IS BLURRED AT 45/60 ANGLE 10295403 EXCEL DOWNLOAD : TOTAL RULE LINES ARE MISSING 10353891 TEXT IN ANGLED BRACKETS IS MISSING FROM FILTER VIEW 10417235 LAYOUT PANE IS CORRUPTED AT TABLE VIEW EDITING. 10647655 COLUMN DATA FORMAT IS IGNORED ON WRITEBACK 11793832 MULTIPLE VALUES IN A DASHBOARD PROMPT DOESN'T WORK WITH BI PUBLISHER 11815935 NLS:THE SETTING FIRSTDAYOFWEEK IN LOCALEDEFINITIONS.XML DON'T AFFECT CALENDAR UI 12325889 SAVING A NEW REPORT TITLE VIEW IS NOT AUTOMATICALLY UPDATED WITH REPORT NAME 12355716 HTML TAGS IN OBIEE 11G REPORTS DOESN'T WORK 12391045 FUNCTION REPORT_AGGREGATE REQUIRES AT LEAST ONE MEASURE COLUMN IN ITS FIRST ARGU 12612904 TOTAL PICKS VALUE IN FIRST ROW AND GIVES NOT A NUMBER WHEN AVERAGING NULL 12638186 EXCEL EXPORT GENERATES A SPACE BEHIND ANY MEASURE VALUE WHEN USING ACTION LINK 12656913 OBI 11G ONDEMAND - DASHBOARD MENU ITEMS DISAPPEAR FROM MENU 12687758 MAPS WITH 500+ TILES TAKE TIME TO LOAD IN FIREFOX AND CHROME (IE FINE) 12696084 FORMAT HEADINGS > HORIZONTAL ALIGNMENT IS NOT WORKING IN TABLE, PIVOT VIEW IN FF 12701383 DOWNLOAD TO EXCEL INCLUDES A BLANK TEXT ROW BELOW THE LAST ROW OF DATA 12715885 HORIZONTAL ALIGNMENT WON'T WORK FOR NARRATIVE, STATIC TEXT VIEW IF EXPORT TO PDF 12725139 VARIABLE VALUES NOT RESOLVED IN TITLE/LEGEND OF CHART, SHOWS FORMULA 12728253 DRILL DOWN TO DETAIL LEVELS DOES NOT WORK FOR THIRD DIMENSION ON ROW EDGE 12776086 REPORT COLUMN SELECTOR IS NOT BEING UPGRADED PROPERLY 12787619 EXPORTED EXCEL:THE 11TH COLUMN HEADING'S FONTS INCORRECT AND LINES ARE MISSING 12807186 OPTION TO NOT SUPPRESS POPUP DOES NOT WORK WITH COLUMN SELECTOR ACTIONS 12822192 DOWNLOAD TO EXCEL WITH DATA FORMATTED COLS AND LOCALE OTHER THAN ENGLISH ISSUE 12826429 MULTIPLE-SELECT PROMPTS DO NOT APPEAR IN UPGRADED ENVIRONMENT 12905237 MAP VIEW DOES NOT FIT FILTERED LAYERS 12908486 UPGRADING 11.1.1.3 TO 11.1.1.5 GAUGE TITLES FOOTER CHANGED FROM "@1 %" TO "@0 %" 12911049 EXPORT (PDF, EXCEL, ETC.) OPTION IS NOT EXPORTING ALL ROWS OF A REPORT 12914177 DON'T SHOW NULL PROJECT_INACCESSIBLE_COLUMN_AS_NULL COLUMN IN SUBJECT AREA 12921728 DXE MAKING UNNECESSARY COPY OF DATA FOR SINGLE AXIS LAYOUTS 12952452 DEFAULT VALUE FOR COLUMN SELECTOR VIEW IS THE FIRST VALUE OF THE COLUMN LIST 12960177 ADDING CALCULATION TO THE HIERARCHY COLUMN IN SELECTION STEPS RESULTS IN ERROR 12963080 LINE BAR 3D GRAPH IS UPGRADED TO CYLINDRICAL BAR 3D GRAPHS 12977729 HIERARCHICAL COL DRILLING ON MORE THAN ONE PAGE OF RESULTS LOSES FOCUS ON DRILL 12978196 COLUMN SELECTOR DOES NOT PASS VALUES FROM SUMMARY REPORT TO DETAILED REPORT 12981896 MAPVIEWER HOVER TOOLTIPS SHOW WRONG VALUES 12992697 PAGE BREAK WITH COLUMN BREAK DOES NOT WORK IN PRINTABLE HTML 13008956 DISABLE AUTO-PREVIEWING OF RESULTS NOT WORKING 13024366 SOLARIS CRASH WHILE MODIFYING GRAPH IN ANALYTIC REPORTS 13054445 REPLACING NULL VALUES WITH "0" IN AN OBIEE PIVOT TABLE IS NOT WORKING 13062842 HORIZONTAL SCROLL BAR IS NOT DISPLAYED ON EDITING DATABASE DIRECT REQUEST 13084799 QUERIES AGAINST BISERVER NOT LEVERAGING FORWARD ONLY OPTION 13110980 THE SECTION PROPERTIES OF PIVOT TABLE IS NOT EFFECTIVE OR NOT CORRECT 13111799 GRAPHING ENGINE IS NOT RESPONDING ERROR HAPPENED. 13249783 AFTER APPLYING PATCH 129725592, OBIEE 11G THROWS BAD XML INSTANCE 13253545 ADDING A NEW GROUP SHOWS EMPTY COLUMN 13256635 VIEWUICONTAINER ERRORS FOR UPGRADED REPORTS 13256990 "NODE WADS NOT FOUND" ERROR OCCURS WHEN UPGRADE 10G CATALOG AND REPOSITORY 13258962 BI SERVER CRASHING STD::BAD_ALLOC ORA-24550 ERROR THEN RESTARTING 13331075 UNABLE TO DRAG MULTIPLE CATALOG ITEMS TO A DASHBOARD 13359653 ANALYSIS QUERY IS NOT CANCELED PROPERLY. 13366675 INAPPROPRIATE PRE-RESERVES WITH STRINGBUFFER 13370386 "THE CURRENT XML IS INVALID WITH THE FOLLOWING ERRORS: BAD XML INSTANCE!" OCCURS 13383217 QDR ISCUSTOMGROUPUNIQUEID DOES UNNECESSARY STRING CONCATENATION 13384157 LARGE SMA BUCKET SIZES NEED TO BE ALIGNED TO POWERS OF 2 13386650 DOWNLOADING INTO EXCEL WITH CONDITIONAL FORMAT BREAKS DATA FORMAT 13386728 OBIEE 11G EVALUATE FORMULA FAILS IF PARAMETERS HAS % OR / 13393602 RSUM NOT CALCULATING CORRECTLY WHEN THERE ARE EXCLUDED COLUMNS 13398245 PROMPT VALUE IS NOT PASSED ON NAVIGATION IF THE PROMPT SECTION IS COLLAPSED 13400140 MULTI-STEP PROMT MISSING THE DASHBOARD PROMPT WHICH "LIMIT VALUES BY" IS SET 13401386 AUTO PREVIEW ARE NOT PREVENTED EXCEPT PIVOT VIEW 13401775 RESET BUTTON DOES NOT CLEAR MESSAGE ABOUT WRONG DATE FORMAT 13403816 AFTER APPLIED MLR 13110245 STILL HAVING THE HIERARCHICAL PROMPT ISSUE 13405110 OPENING REPORT CRASHES BI PRESENTATION SERVICES 13409646 CALCULATED ITEMS CAUSE MANY INTERNAL CUBES WITHIN DXE 13416870 RACE CONDITION IN PRESORTED CUBE 13418590 EXPORT TO EXCEL NOT WORKING PROPERLY (LINUX 64) 13434349 "LIMIT ROWS BASED ON SECTION VALUES" PROPERTY IS NOT EFFECTIVE FOR GRAPH PIVOT 13440792 EXPORT TO EXCEL WITH REGIONAL SETTINGS OTHER THAN ENU 13444157 ERROR WHEN USE "IS IN TOP" OPERATOR IN FILTER WITH PRESENTATION VARIABLE 13447368 COLUMN FORMAT PROPERTY IS NOT SAVED 13458667 HIDDEN OPTION NOT AVAILABLE FOR DATE COLUMNS IN TABLE LAYOUT 13471332 NEW MEMBER STEP WINDOW DOESN'T FIT ALL REQUIRED MEMBER SELECTION 13477147 CREATE PROMPTED LINK CREATES A LINK WITH THE NAME OF THE VARIABLE 13479613 CANNOT MODIFY REPORT/DASHBOARD WHEN USER HAS READ-WRITE BUT NO DELETE PERMISSION 13498324 PERFORMANCE DEGRADATION FOR PARENT-CHILD HIERARCHY QUERY FROM 11.1.1.6.0 13501903 EXCEL DOWNLOAD ERRORS WITH DOUBLE QUOTES AND EMBEDDED COMMAS 13502763 DRILL DOWN ON REGULAR COLUMN WITH CUSTOM DATE FORMAT 13516292 REPOSITORY INIT BLOCKS LOSE CONNECTION TO DATABASE AND NEVER REGAIN IT 13517767 POSITIONAL CALC CAN CAUSE XMLWRITER EMPTY DOCUMENT ERROR 13522214 VALUE-BASED HIER PROMPT SEARCH RESULTS IN ODBC ERROR 13522246 DASHBOARD EMBEDDED IN IFRAME MODIFIES PORTALPATH OF SINGLETON SESSIONINFO 13523548 ERROR OUT WHEN USING MULTIPLE DOUBLE COLUMNS IN SAVED FILTERS 13526747 PIVOT CHART LEGEND DUPLICATES MEASURE LABELS. 13529441 MULTI DASHBOARD PROMPT DOESN'T WORK WITH BI PUBLISHER INTEGRATED 13533404 SECTIONS HEADERS ARE CAUSING DASHBOARD SPACING ISSUES 13539267 HIERARCHY IN PIVOT TABLE AND BAR CHARTCAUSES ERROR 13541432 PIVOT SORT BUTTON DISAPPEARS WHEN SELECT "AFTER" FROM THE TOTAL OF "COLUMNS" 13542145 UNION ERROR IN WHEN FILTERING A COLUMN THAT HAS A DESCRIPTOR ID COLUMN 13546009 SELECT PIVOT TABLE IN VIEW SELECTOR CAUSES COLUMN TO BE EXCLUDED WHEN DRILLING 13567100 CASE WHEN USED IN MEASURE IN PIVOT IS NOT WORKING AS IN 10G 13570406 MAP VIEW DOESN'T DISPLAY THE CORRESPONDING LEVEL DATA AFTER DRILL DOWN 13577428 PIVOT TABLE FORMATTING ISSUE 13585714 USING "FORMAT TITLE VIEW" IN ANSWERS- RESULTS - TITLE THROWS "INVALID XML" ERROR 13586709 GRAPH PIVOTED VIEW POSITION DOES NOT REMAIN SAME. 13599283 BRIEFING BOOK DOESNT SHOW SAVED CUSTOMIZATIONS VIA A LINK. 13605450 'MY FOLDERS' DOESN'T SHOW IN DASHBOARD EDITOR WHEN USERNAME HAS PARENTHESES 13606302 "DO NOT DISPLAY IN A POPUP" ACTION LINK INCORRECT BEHAVIOR (HIERARCHY LEVEL COL) 13615198 RIGHT CLICK INCLUDE MSR NEEDS TO ADD TO MSR BIN, NOT COLUMN. 13616593 AUTO PREVIEW ARE NOT PREVENTED FOR GRAPH 13627902 MAPS ARE PRINTED IN GREY WHEN LOG IN USING ITALIAN LANGUAGE 13641963 BACKSPACE BUTTON AFFECTS THE MAIN WINDOW INSTEAD OF POP-UP WINDOW 13647309 GRAND TOTAL FUNCTIONALITY INCORRECT AND INCONSISTENT WITH OLAP CUBES 13682411 CALC ITEM NOT DISPLAYED IN A PIVOT TABLE 13688544 'CASE WHEN' CHANGES TO 'CASEWHEN' IN XML AND CAUSES ERROR WHEN SET XML 13704274 SECURITY FILTERS ARE INCORRECTLY APPLIED TO LEVEL-BASED MEASURES 13724002 PIVOT TABLE TITLE TRANSLATING PROBLEM 13774538 GRAPH TITLE DISPLAYING VARIABLE CODE @{TESTCASE} ON EXPORTED TO PDF FILE. 13774635 OBIPS THROWING ASSERTION WHILE RUNNING THE CACHE SEEDING AGENT 13788536 GRAPH PIVOTED RESULTS PREVENTS ADDING NEW COLUMNS TO CRITERIA 13792237 ADMINTOOL CRASHES WHEN DELETING MULTIPLE PHYSICAL TABLES 13815409 MULTIPLE PIE CHARTS DISPLAYED FOR PIVOT TABLE REPORT WHEN SHOULD BE ONE 13827099 ADD ADDITIONAL ASCENDING SORT RESULTS IN ERROR 13844868 BI PRESENTATION SERVICE FAILS TO START IN PARALLEL WITH OTHER BI COMPONENTS 13897448 FILTER ON A COLUMN WITH A FOMULA CREATED BY BIN DOES NOT COMPLETE 13933009 DOUBLE COLUMN (DESCRIPTOR ID) DASHBOARD PROMPT - ENABLE SQL RESULTS ON CODE COL 13944009 INCORRECT REPORT LINK GETS GENERATED IN IE8 13946535 REFRESH ISSUE OF ALL VALUES IN FILTERDROPDOWN NOT RESIZED AND VALUES NOT VISIBLE 13963768 HIDE COLUMNS ON DASHBOARD NOT WORKING CORRECTLY 13983193 ALIAS THAT HAS AN '&' IN THE NAME CAUSES ERROR ROOT XML NODE NQW NOT FOUND 13986530 OBIEE CRASHES IF RUN MULTIPLE QUERIES CONCURRENTLY ON SAP/BW FOR THE FIRST TIME 14005093 OBIEE PRESENTATION SERVER AND JAVAHOST FAILS AFTER CONSOLE LOGOFF EVENT 14021534 MISSING PROMPT FIELD IF THE DASHBOARD PAGES CONTAIN DUPLICATE PROMPT PAGE 14025087 UNCHECK "SHOW APPLY BUTTON" CAUSE PROBLEM ON RESTRICTED DASHBOARD PROMPT COLUMN 14053994 ACTION LINKS DON'T WORK WHEN HAVING COLUMN SELECTOR AND USING CHROME
Extra Steps
Copy Client Tools etc.
cd $MW_HOME/Oracle_BI1/clients/bipublisher/repository/Tools cp BIPublisherDesktop*.exe $MW_HOME/user_projects/domains/bifoundation_domain/config/bipublisher/repository/Tools/
Update client tools from get started section in OBIEE.
The Admin Tool lists its version in
C:\Program Files x86\Oracle Business Intelligence Enterprise Edition Plus Client\oraclebi\orahome\bifoundation\version.txt
Build: 11.1.1.6.0.BIFNDN_11.1.1.6.2BP1_NT_120604.0813 Release Version: Oracle Business Intelligence 11.1.1.6.0 Package: 120604.0136.000
OBIEE 11G has a catalog manager command called “ClearQueryCache” to clear out the PS cache.
The syntax of ClearQueryCache command is: runcat.cmd/runcat.sh -cmd clearQueryCache -online <OBIPS URL> -credentials <credentials properties file>
Create a catalog manager credential properties file. Open a text file and type the following entries. Login = <weblogic_admin_Username> Pwd = <weblogic_Admin_Userpassword> And save in a directory with the file name as catmancredentials.properties.
Now open command prompt and navigate to <MW_HOME>instances\instance1\bifoundation\OracleBIPresentationServicesComponent\coreapplication_obips1\catalogmanager\
And Run the following command to clear OBIPS query cache: runcat.cmd -cmd clearQueryCache -online http://host:9704/analytics/saw.dll -credentials E:\catmancredentials.properties
When Creating a Document on Domain values that have been mapped to target values etc in BIACM we can use the BIACOMP schema to derive various pieces of information.
Below are some querys that can be used to get information on mappings etc.
Offerings enabled
select offering_code,offering_name from c_bia_offering where installed_flag = 1;
Functional Areas in the Offerings
select offering_key,funcarea_key from c_bia_offering_funcarea_rel where offering_key in ('FIN_AN_OFRNG', 'PROC_SPEND_AN_OFRNG', 'SCOM_AN_OFRNG') order by 1,2
Data Load Parameters
select c_param.param_category_key,c_param.param_code, c_param.param_key,c_param.param_name ,c_param.param_descr,c_param.param_type,c_param.param_value_type,param_value_varchar2 ,param_value_date,param_value_number,c_param_dw_val.datasource_num_id from c_param ,c_param_dw_val where c_param.param_key = c_param_dw_val.param_key and product_line_version_key = 'EBS_12_1_3' --and c_param.param_code = 'HR_ACCRUAL_OTHER_AMT' and datasource_num_id > 0 order by datasource_num_id,c_param.param_category_key,c_param.param_code;
Top level mapping
select distinct dom_map.src_domain_key, c_domain.domain_code source_code,src_dom.domain_name src_domain_name ,dom_map.trg_domain_key ,trg.domain_code target_code,trg_dom.domain_name trg_domain_name from c_domain_map dom_map ,c_domain ,c_domain_tl src_dom ,c_domain trg ,c_domain_tl trg_dom where dom_map.src_domain_key = c_domain.domain_key and dom_map.src_domain_key = src_dom.domain_key and src_dom.src_language_code = 'US' and dom_map.trg_domain_key = trg.domain_key and dom_map.trg_domain_key = trg_dom.domain_key and trg_dom.src_language_code = 'US' --and trg.ref_product_line_key = 'EBS';
All Mappings and Member Domain Values etc
select q1.*,dom_map.src_domain_member_code,dom_map.trg_domain_member_code,dom_map.datasource_num_id ,source_member.domain_member_name source_member_name ,target_member.domain_member_name target_member_name from c_domain_member_map dom_map ,c_domain_member dom_member ,(select distinct dom_map.src_domain_key, c_domain.domain_code source_code,src_dom.domain_name src_domain_name ,dom_map.trg_domain_key ,trg.domain_code target_code,trg_dom.domain_name trg_domain_name from c_domain_map dom_map ,c_domain ,c_domain_tl src_dom ,c_domain trg ,c_domain_tl trg_dom where dom_map.src_domain_key = c_domain.domain_key and dom_map.src_domain_key = src_dom.domain_key and src_dom.src_language_code = 'US' and dom_map.trg_domain_key = trg.domain_key and dom_map.trg_domain_key = trg_dom.domain_key and trg_dom.src_language_code = 'US' and trg_dom.domain_name in ('Conformed Currency Rate Type') ) q1 ,(select * from c_src_domain_member_tl where language_code = 'US') source_member ,(select * from c_domain_member_tl where language_code = 'US') target_member where dom_map.src_domain_key = q1.src_domain_key and dom_member.domain_key = q1.trg_domain_key and dom_map.src_domain_member_code = dom_member.domain_member_code and dom_map.domain_plv_key = source_member.domain_plv_key and dom_map.src_domain_member_code = source_member.domain_member_code and q1.trg_domain_key = target_member.domain_key and dom_map.trg_domain_member_code = target_member.domain_member_code order by source_code,target_code,src_domain_member_code;
How to Add String Localizations for Oracle BI Repository Metadata
OBIEE RPD – Init Block : RPD Msgs
If you added a new Column or Subject Area, follow this procedure to add string localizations in the Oracle BI Repository metadata.
To add string localizations for Oracle BI repository metadata:
1. Stop the OPMN services. Use the command:
opmnctl stopall.
2. Open a database administration tool, and connect to the Oracle Business Analytics Warehouse schema.
3. Identify the strings for the following presentation objects: - Subject area - Presentation table - Presentation hierarchy - Presentation level - Presentation column For example, for the subject area Payables Invoices - Prepayment Invoice Distributions Real Time, you would enter the following strings: Table 4-1 Example of Localization Strings
String
Presentation Object
Payables Invoices - Prepayment Invoice Distributions Real Time
Subject area
Time
Presentation table
Date – Year
Presentation hierarchy
Total
Presentation level
Year
Presentation level
Calendar Year
Presentation column
4. For each subject area, externalize the strings for localization and generate custom names for the presentation objects: a. In the Oracle BI Administration Tool, right-click the subject area and select Externalize Display Names, and then select Generate Custom Names. b. Save your work. For more information about localizing strings, see "Localizing Metadata Names in the Repository," in Oracle Fusion Middleware System Administrator's Guide for Oracle Business Intelligence Enterprise Edition.5. Check the consistency of the repository, and remove any inconsistencies. For instructions, see "Checking the Consistency of a Repository or Business Model," in Oracle Fusion Middleware Metadata Repository Builder's Guide for Oracle Business Intelligence Enterprise Edition (Oracle Fusion Applications Edition). 6. Enter the custom name of one of the presentation objects into the table C_RPD_MSGS:
7. INSERT INTO C_RPD_MSGS(MSG_ID, CREATED_BY, CREATION_DATE)
8. VALUES('<CUSTOM NAME OF PRESENTATION OBJECT>', 'CUSTOM', SYSTIMESTAMP);
9. COMMIT;
Note: To view the values for custom names and logical columns in the Administration Tool, right-click the presentation object and select Properties. The data in the "Custom display name" field appears in the format VALUEOF(NQ_SESSION.VALUE, where VALUE is the custom name for a presentation object, or the logical value for a presentation column. This value is the value that you need to enter in the VALUES section of the SQL statement above.
10. Enter the localized string for the presentation object in the previous step into the table C_RPD_MSGS_TL:
11. INSERT INTO C_RPD_MSGS_TL(MSG_ID, MSG_TEXT, LANGUAGE_CODE, CREATED_BY, CREATION_DATE)
12. VALUES('<CUSTOM NAME OF PRESENTATION OBJECT>', '<LOCALIZATION OF THE STRING'>, '<LANGUAGE CODE FOR TRANSLATED LANGUAGE>', 'CUSTOM', SYSTIMESTAMP);
13. COMMIT;
To identify the language code for a particular language, use the following SQL: SELECT LANGUAGE_CODE, NLS_LANGUAGE, NLS_TERRITORY FROM FND_LANGUAGES_B WHERE INSTALLED_FLAG IN ('B', 'I');
14. Enter additional details about the presentation object into the table C_RPD_MSGS_REL as indicated by the following SQL:
15. INSERT INTO C_RPD_MSGS_REL(MSG_ID, MSG_NUM, MESSAGE_TYPE, CREATED_BY, CREATION_DATE)
16. VALUES('<CUSTOM NAME OF PRESENTATION OBJECT>', '<TRANSLATION OF THE STRING'>, '<LANGUAGE CODE FOR TRANSLATED LANGUAGE>', 'METADATA','CUSTOM', SYSTIMESTAMP);
17. COMMIT;
18. Repeat steps 6 through 8 for each presentation object requiring localization.
19. Validate that the physical connection of the session initialization block INIT_USER_LANGUAGE_CODE is operable:
a. In the Oracle BI Administration Tool, select Manage, Variables, Session Initialization Block. b. Right-click INIT_USER_LANGUAGE_CODE. c. In the Properties dialog, click Edit Data Source. d. Click Test, and input the value for the language code. Then, click OK. For example, for Arabic enter 'AR'. The value
USER_LANGUAGE_CODE = '<language code>' should be returned. If this value is not returned, the TNS entry for the data source is not properly configured.
20. Restart the OPMN services.
21. Verify the localized strings in Oracle BI Answers. On the login page, specify the appropriate language.
I wanted to create a model called RX Oracle BI Applications not linked to BI Applications so that I can keep the custom models separate from the seeded models. Remember you still need to name your folders Dimension_Stage .. same as seeded etc
4.Duplicate the Existing Package Exec TABLE_MAINT_PROC and refer the procedure step to the new duplicated procedure above.
5.Generate a new scenario
6.Duplicate a seeded IKM
Left Click to Duplicate an object
7.Edit the duplicated IKM
Under Details then step “Table Maintenance Before”
Alter the python code – Update to new Scenario name generated above with new Procedure to support a model apart from Oracle Applications.
That’s it test your new interfaces using the New Knowledge Module. Import the Knowledge module into your project.
---------- Reference Code in TABLE_MAINT_PROC
if (td.mTableModelCode.equals("BIAPPS")||td.mTableModelCode.equals("BIAPPS_DATALINEAGE")||td.mTableModelCode.equals("ORACLE_BI_APPLICATIONS")) {
optOverride = odiRef.getFlexFieldValue(Integer.toString(td.mTableId), "2400", "OBI_TAB_MAINT_BEHAVIOR"); //FlexField for Over-riding the default Sub Model Behaviour
} else { optOverride = "NEVER_SKIP_ALLSTATS"; // For non-BIAPPS model do nothing
}
---------- I Have included the snippet that requires changingin earlier steps.
The definition of these errors dont exist anywhere hence the post.
1.
Error Message :
********WARNING: Load Plan template referenced in a master load plan template but not defined => 3 SIL Fact X_CUSTOM_FG
This error means that in ODI Studio under Load Plans - Location ->
LOAD PLAN – DEV COMPONENTS – SIL
The above Load Plan Does not exist . Create a new load plan under the above location and rename to to the name the error requires ie 3 SIL Fact X_CUSTOM_FG.
Me and Krishna at DeliverBI had to create a new CUSTOM BIACM Offering and Fact group for one of our longstanding clients, to seperate E Business Suite data loads Out Of the Box and their own Custom data sources. On the Back of the changes we wrote a setup document.
So we have decided to share this with the OBIA / OBIEE Community. Extension Documented was Applied to OBIA 11.1.1.7.1 and OBIA 11.1.1.8.1+
I have uploaded a document which covers setting up new functionality that is not available out of the box. We have included scripts needed to expand the offerings within the BIACM tool within OBIA and instructions to configure
BIACM Config. 2
Step 1: Creation of Custom Offering. 2
Step 2: Creation of Source for the new offering. 2
Step 3: Creation of Custom Functional Area. 2
Step 4: Creation of relation between Offering and Functional Area. 3
Step 5:Creation of fact group (Repeat for each Fact Group). 3
Step 6: Creation of Func Area to Fact Group Relation (Repeat for each Fact Group). 3
Linking BIACM Fact Groups to ODI Objects. 4
Fact Model / Dimension Model4
Load Plan Steps (provided only for SILs, but SDE steps will be the same). 5
Dev Components. 5
Load Plan System Component (Required for a New Fact Group or Dim Group). 7
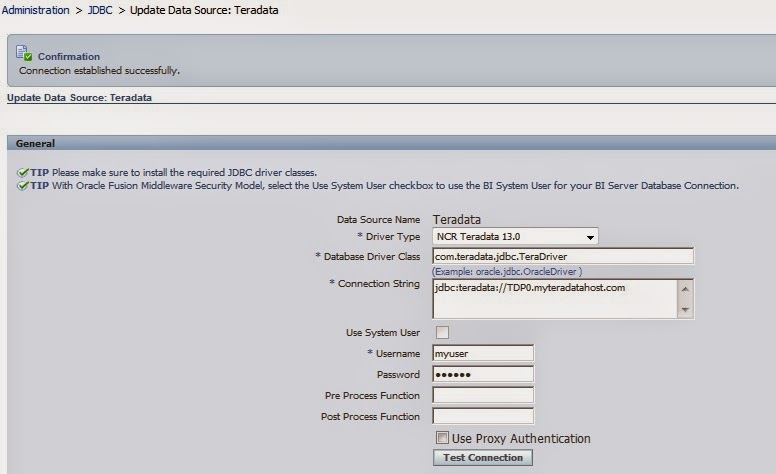
I could see a database connection type of Teradata in BI Publisher but it would not connect.
If there is an error would be something like this : java.sql.SQLException: No suitable driver found for jdbc:teradata: These are the steps to make it work.... 1.Get Files terajdbc4.jar,tdgssconfig.jar,jtds-1.3.1.jar from Teradata Website . I will put these files in the deliverbi box location or email us for the files...
MW_HOME/user_projects/domains/bifoundation_domain/lib 3. Stop all BI Services including weblogic and Copy the files above to the location above 1-2. 4. Take a backup of the weblogic temporary files in the below location and place in another location and then delete folders .. This will clear the Bipublisher application Cache:
MW_HOME\user_projects\domains\bifoundation_domain\servers\bi_server1\tmp\_WL_user\bipublisher_11.1.1 Once BI Publisher is accessed the application cache is restored and you will see the folders again. I took a back up as i wanted to be sure.... 5. Start all BI Services 6. Test Connection - Should say Connection Established Successfully.
In 11.1.1.9.0 + there is functionality that needs to be enabled in the Oracle BI Administration tool options that enables the use of editing presentation object table and column names. Turn it on .... and your off. Tools .. Options
BI 12c delivers a major update to the Oracle BI platform, with enhancements across the entire platform, as well as new Data Visualization capabilities. Highlights and benefits include:
Easy to upgrade: BI 12c offers a radically simple and robust upgrade from 11g, saving customers time and effort in moving to the new version. BI 12c includes a free utility to automate regression testing, the Baseline Validation Tool, which verifies data, visuals, catalog object metadata, and system-generated SQL across 11g and 12c releases.
Faster: Sophisticated in-memory processing includes BI Server optimizations and support for multiple in-memory data stores, while in-memory Essbase on Exalytics offers enhanced concurrency and scalability, as well as significant performance gains.
Friendlier: Usability updates throughout BI 12c demonstrate Oracle’s continued commitment to making analytics as fast, flexible, and friendly as they are powerful and robust. A new user interface simplifies the layout for the homepage, Answers, and Dashboards, making it easier for users to quickly see what’s important; HTML-5 graphics improve view rendering; and it’s easier for users to create new groups, calculations, and measures, for simpler, more direct interaction with results.
More Visual: A consistent set of Data Visualization capabilities are now available across Oracle BI Cloud Service and Oracle BI 12c, as well as the upcoming Oracle Data Visualization Cloud Service, offering customers a continuity of visual experience unmatched by our competitors. Business users can point and click to upload personal data and blend it with IT-managed data in BI 12c, which automatically infers connections between data sets. Visualizing data is as easy as dragging attributes onto the screen, with optimal visualizations automatically displayed – no modeling or upfront configuration required. Related data is automatically connected, so highlighting data in one visual highlights correlated data in every other visual, immediately showing patterns and revealing new insights. These insights, along with narrative comments, can be shared as interactive visual stories, enabling seamless collaboration that drives fact-based decisions.
More Advanced: Predictive analysis is more tightly integrated, enabling customers to more easily forecast future conditions based on existing data points, group elements that are statistically similar, and expose outliers. BI 12c includes the ability to run the free Oracle R distribution on BI Server, and extend existing analytics with custom R scripts, which can point to any engine (R, Oracle Database, Spark, etc.) without needing to change the BI RPD to deliver results.
More Mobile: Keyword search (“BI Ask”) empowers users to literally talk to their data, asking questions and having visualizations automatically created as responses, opening up an easy entry point for authoring. Additionally, the interface for iOS has been completely redesigned; and Mobile BI for Android offers sharing and following for nearby devices, as well as the ability to project any dashboard or story to GoogleCast-enabled devices.
Bigger Data: BI 12c enables customers to use new data, from local, Oracle, and Big Data sources, including personal files uploaded by users; direct access to data in Hyperion Financial Management and Hyperion Planning applications; and ODBC access to Cloudera Impala. Apache Spark will be accessible via native Spark SQL in an upcoming update.
Higher ROI, Lower TCO: Streamlined administration and life cycle management reduce the time and resources required to manage BI 12c, decreasing costs and increasing value for this and future releases. Enhancements include separating metadata from configuration; simpler, more robust security; easier backup, restore, and disaster recovery; hot patching of metadata; and many more.